US Census Classification#
What are we going to do?#
Note: This is a replication of the US Census Classification example using the Task Module.
In this quick demo, we will use JAI to:
Train and deploy models into a secure and scalable production-ready environment.
Complete a classification task - Predict whether household income exceeds $50K/yr based on census data
Importing libraries#
[1]:
from jai import Trainer
import pandas as pd
Dataset quick look#
This dataset contains data collected by the 1994 U.S. Census. It contains personal information such as education, marital status, occupation and sex and in this example we will use that data to predict whether an individual is making more or less that 50k dollars per year.
[2]:
df = pd.read_csv('https://myceliademo.blob.core.windows.net/census-us/adult.csv?sv=2020-04-08&st=2021-05-17T18%3A19%3A59Z&se=2025-01-18T18%3A19%3A00Z&sr=b&sp=r&sig=sH%2B2Za%2FTuXsatqgmRX3eG%2FQfZTh1M2ptMUi8NTXBXF4%3D')
df = df.reset_index().rename(columns={'index':'id'})
[3]:
# Show name of columns and non-null count
df.info()
<class 'pandas.core.frame.DataFrame'>
RangeIndex: 32561 entries, 0 to 32560
Data columns (total 16 columns):
 #   Column          Non-Null Count  Dtype
---  ------          --------------  -----
 0   id              32561 non-null  int64
 1   age             32561 non-null  int64
 2   workclass       32561 non-null  object
 3   fnlwgt          32561 non-null  int64
 4   education       32561 non-null  object
 5   education.num   32561 non-null  int64
 6   marital.status  32561 non-null  object
 7   occupation      32561 non-null  object
 8   relationship    32561 non-null  object
 9   race            32561 non-null  object
 10  sex             32561 non-null  object
 11  capital.gain    32561 non-null  int64
 12  capital.loss    32561 non-null  int64
 13  hours.per.week  32561 non-null  int64
 14  native.country  32561 non-null  object
 15  income          32561 non-null  object
dtypes: int64(7), object(9)
memory usage: 4.0+ MB
[4]:
# Show first 5 lines of dataframe
df.head()
[4]:
| id | age | workclass | fnlwgt | education | education.num | marital.status | occupation | relationship | race | sex | capital.gain | capital.loss | hours.per.week | native.country | income | |
|---|---|---|---|---|---|---|---|---|---|---|---|---|---|---|---|---|
| 0 | 0 | 90 | ? | 77053 | HS-grad | 9 | Widowed | ? | Not-in-family | White | Female | 0 | 4356 | 40 | United-States | <=50K |
| 1 | 1 | 82 | Private | 132870 | HS-grad | 9 | Widowed | Exec-managerial | Not-in-family | White | Female | 0 | 4356 | 18 | United-States | <=50K |
| 2 | 2 | 66 | ? | 186061 | Some-college | 10 | Widowed | ? | Unmarried | Black | Female | 0 | 4356 | 40 | United-States | <=50K |
| 3 | 3 | 54 | Private | 140359 | 7th-8th | 4 | Divorced | Machine-op-inspct | Unmarried | White | Female | 0 | 3900 | 40 | United-States | <=50K |
| 4 | 4 | 41 | Private | 264663 | Some-college | 10 | Separated | Prof-specialty | Own-child | White | Female | 0 | 3900 | 40 | United-States | <=50K |
Inserting data into Jai#
To be able to use Jai’s functionalities, we first need to turn the data into a Jai collection. In this example, we’ll use the Trainer module to send data to Jai. We’ll use the trainer.fit method to created the collection, which can then be consumed through the Query Module. By using the fit method you add your raw data to your JAI environment, use the data to train your model based on the chosen model type and your model’s latent vector representation is then stored in the Jai collection.
[5]:
trainer = Trainer(
    # Name of Jai collection
    name = 'census',
    # verbose = 2 shows loss graph at the end of the setup
    verbose = 2
    )

trainer.set_parameters(
    db_type = 'Supervised', # other options are: Text, FastText, TextEdit, Image, Supervised, Selfsupervised

    # On supervised models we need to inform the label.
    label = {'task':'classification', 'label_name':'income'}, # other options are: classification, metric_classification, regression, quantile_regression

    split = {'type':'stratified', 'split_column':'income', 'test_size':0.1},
)

# When frequency_seconds >= 1, fit will return a Query object ready to consume the collection.
query = trainer.fit(

    # data to be inserted into Jai - a pandas dataframe is expected
    data = df,

    overwrite = True
    )
Recognized fit arguments:
- db_type: Supervised
- label:
  * task      : classification
  * label_name: income
- split:
  * type        : stratified
  * split_column: income
  * test_size   : 0.1
Insert Data: 100%|██████████| 2/2 [00:01<00:00, 1.16it/s]
Recognized fit arguments:
- db_type: Supervised
- label:
  * task      : classification
  * label_name: income
- split:
  * type        : stratified
  * split_column: income
  * test_size   : 0.1
JAI is working: 100%|██████████|22/22 [00:57]
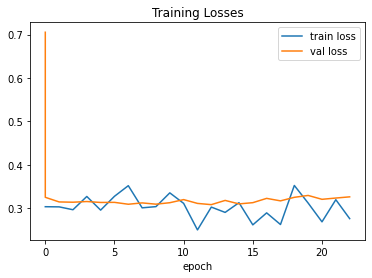
Setup Report:
Metrics classification:
              precision    recall  f1-score   support

       <=50K       0.89      0.92      0.91      2472
        >50K       0.73      0.64      0.68       784

    accuracy                           0.85      3256
   macro avg       0.81      0.78      0.79      3256
weighted avg       0.85      0.85      0.85      3256


Best model at epoch: 12 val_loss: 0.31
Model Inference#
We can use the trained model to make inferences on any specific index or in other added new data
[6]:
# It's also possible to get the same query object from fit as shown bellow:
from jai import Query
query = Query(name = 'census')
[7]:
df.tail(1).drop('income',axis = 1)
[7]:
| id | age | workclass | fnlwgt | education | education.num | marital.status | occupation | relationship | race | sex | capital.gain | capital.loss | hours.per.week | native.country | |
|---|---|---|---|---|---|---|---|---|---|---|---|---|---|---|---|
| 32560 | 32560 | 22 | Private | 201490 | HS-grad | 9 | Never-married | Adm-clerical | Own-child | White | Male | 0 | 0 | 20 | United-States |
[8]:
query.predict(
    data = df.tail(1).drop('income',axis = 1),
    # predict_proba = True shows the probability that the item belongs to each class
    predict_proba = True)
Predict: 100%|██████████| 1/1 [00:00<00:00, 2.47it/s]
[8]:
[{'id': 32560,
  'predict': {'<=50K': 0.9999680519104004, '>50K': 3.19505634251982e-05}}]
[9]:
query.predict(
    data = df.head().drop('income',axis = 1),
    # predict_proba = True shows the probability that the item belongs to each class
    predict_proba = True)
Predict: 100%|██████████| 1/1 [00:00<00:00, 2.45it/s]
[9]:
[{'id': 0,
  'predict': {'<=50K': 0.8733702898025513, '>50K': 0.12662969529628754}},
 {'id': 1,
  'predict': {'<=50K': 0.7550706267356873, '>50K': 0.24492938816547394}},
 {'id': 2,
  'predict': {'<=50K': 0.6213910579681396, '>50K': 0.37860894203186035}},
 {'id': 3,
  'predict': {'<=50K': 0.9679034352302551, '>50K': 0.03209662809967995}},
 {'id': 4,
  'predict': {'<=50K': 0.5875391364097595, '>50K': 0.4124608337879181}}]